
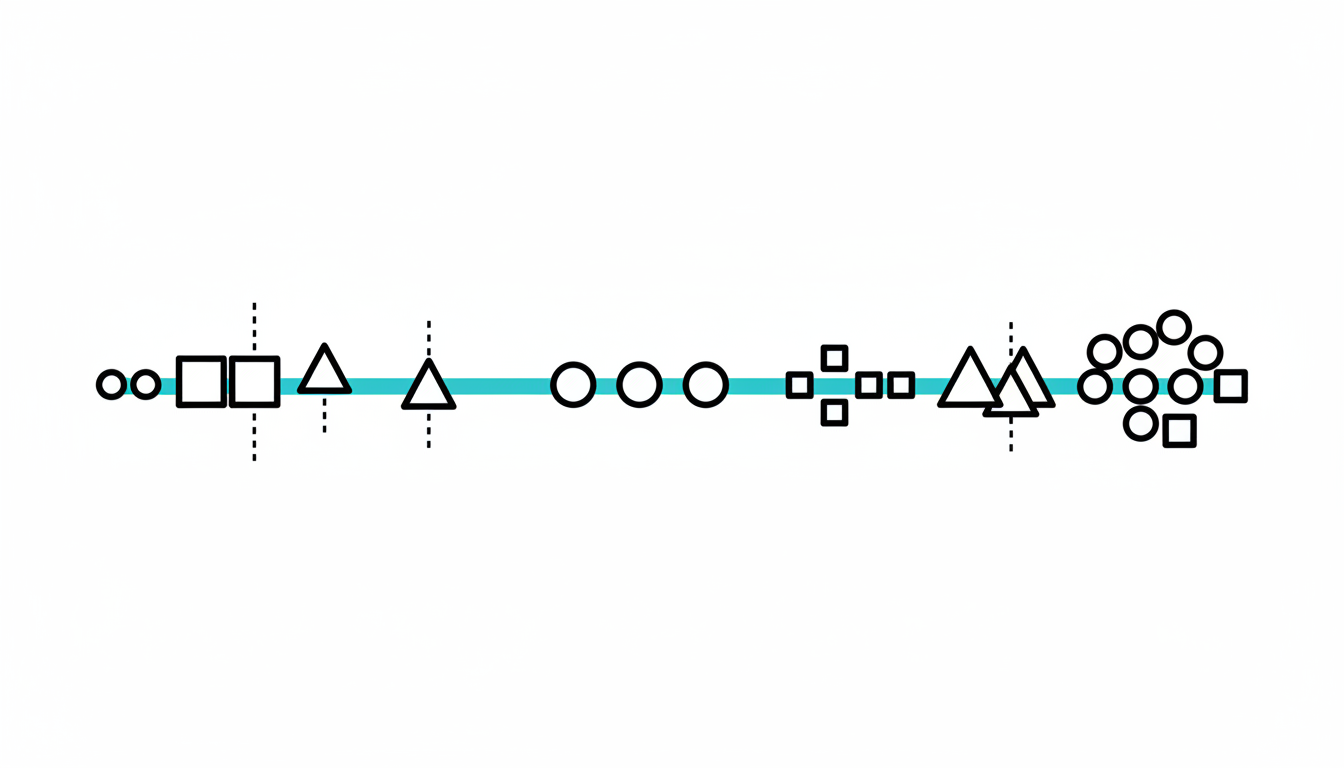
Spectrum Mapping
At a Glance
- Time: 3-4 minutes
- Prep: None
- Group: Small groups or whole class
- Setting: Any classroom
- Subjects: Universal
- Energy: Medium
Purpose
Visually organize and evaluate ideas by placing them along a continuum between two extremes, revealing patterns and sparking discussion about criteria and priorities. Use this after brainstorming to categorize ideas, before decision-making to evaluate options, or to analyze concepts on multiple dimensions.
How It Works
Step-by-step instructions:
-
Draw the spectrum (30 seconds) - Draw a horizontal line on the board. Label the left extreme (e.g., "Easy to Implement") and right extreme ("Difficult to Implement"). Or use other spectrums: Conventional/Radical, Low-Cost/High-Cost, Short-term/Long-term
-
Place ideas along the spectrum (2-3 minutes) - After a brainstorming session, groups place their ideas along the spectrum. Each idea gets a sticky note or mark showing where it falls between the two extremes
-
Analyze patterns (1 minute) - Step back and observe: Where did most ideas cluster? Are there gaps? What's in the "sweet spot"? Does position on one spectrum predict position on another?
What to Say
Opening: "We just brainstormed 20 ways to reduce plastic waste. Now let's map them on a spectrum from 'Easy for Individuals' to 'Requires System Change.' Where does 'bring reusable bags' fall? Where does 'ban single-use plastics'? Place all 20 ideas. Then we'll see patterns."
During: "Don't agonize over perfect placement—just get them roughly positioned... If you disagree on placement, that's interesting! Discuss why... Look for clusters... What's missing? Any gaps in the spectrum?"
Closing: "Most ideas clustered on the 'Easy for Individuals' side—but those are also lowest impact. The 'System Change' side has fewer ideas but higher potential impact. What does this tell us? Sometimes the hard-to-implement ideas are the ones worth pursuing. This visual helps us see our bias toward easy over effective."
Why It Works
Spectrum mapping transforms abstract evaluation into concrete visual representation. Spatial arrangement reveals patterns that aren't obvious in list form: clustering (most ideas share similar characteristics), gaps (underexplored regions), outliers (unusual ideas worth examining), and trade-offs (rarely does an idea score high on all desirable dimensions). The visual format makes implicit criteria explicit and forces groups to negotiate shared understanding of what terms like "feasible" or "innovative" actually mean. It turns vague discussion into specific, evidence-based analysis.
Research Connection: Visual thinking tools enhance decision-making by externalizing mental models and making reasoning processes visible and discussable (Eppler & Burkhard, 2007).
Teacher Tip
The best spectrums create productive tension—two dimensions you WANT to score high on but rarely can simultaneously. "High Impact vs. Easy to Implement," "Creative vs. Practical," "Quick vs. Thorough." This forces real evaluation and reveals trade-offs that simple lists hide.
Variations
For Different Subjects
- Any Brainstorming: "Map generated ideas on Feasible/Ambitious, Short-term/Long-term, Individual/Collective"
- Literature: "Map characters on Sympathetic/Unsympathetic, Active/Passive, Static/Dynamic"
- History: "Map historical events on Local Impact/Global Impact, Planned/Accidental"
- Science: "Map solutions on Low Environmental Cost/High Environmental Cost, Proven/Experimental"
For Different Settings
- Large Class (30+): Each group creates their own spectrum on chart paper, then do a gallery walk to compare
- Small Group (5-15): One collaborative spectrum on the board with whole-class negotiation of placement
For Different Ages
- Elementary (K-5): Use physical placement: students stand along a line in the room based on their position
- Middle/High School (6-12): Standard format with multiple spectrums for same set of ideas
- College/Adult: Add complexity: plot ideas on TWO spectrums simultaneously (creates a four-quadrant matrix)
Online Adaptation
Tools Needed: Jamboard, Miro, or Padlet
Setup: Create a horizontal line with labeled endpoints
Instructions:
- Share collaborative board with spectrum drawn
- Students add sticky notes with their ideas along the spectrum
- Use breakout rooms for small groups to create their own spectrums
- Return to main room to compare placements and discuss patterns
- Use voting/dots to identify "sweet spot" ideas
Pro Tip: Miro has a built-in "axis" feature perfect for spectrum mapping
Troubleshooting
Challenge: All ideas cluster at one end—no distribution across the spectrum Solution: "That clustering IS data! Why are we only generating ideas on this end? What would it take to get ideas on the other end? Can we intentionally brainstorm ideas for the empty region?"
Challenge: Groups can't agree on where an idea falls Solution: "Disagreement is valuable! It reveals you're using different criteria. What would make this idea move left? Move right? Can you both be right if you're measuring different dimensions?"
Extension Ideas
- Deepen: Use multiple spectrums for the same ideas: "First map on Feasible/Ambitious, then remap the same ideas on Low-Cost/High-Cost. Do the same ideas stay together or spread out?"
- Connect: Introduce the concept of trade-off curves: "In the real world, you can't usually have maximum of both dimensions—you have to choose. Where's your optimal balance?"
- Follow-up: "Select ideas from different regions of the spectrum and develop implementation plans. How do plans differ based on spectrum position?"
Related Activities: SWOT Analysis, Concept Mapping, Four Corners