
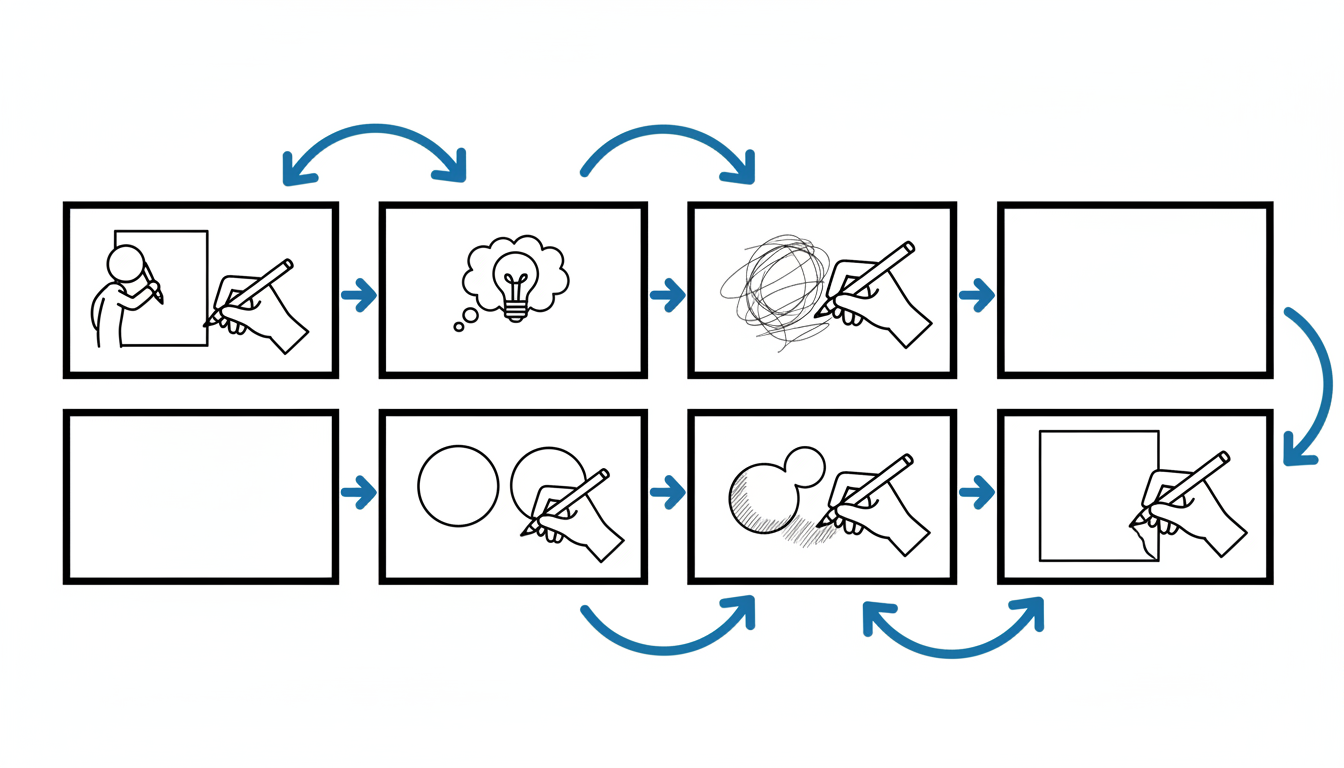
Storyboard
At a Glance
- Time: 3-4 minutes
- Prep: Minimal (create template)
- Group: Individual
- Setting: Any
- Subjects: Science, History, Processes
- Energy: Medium
Purpose
Assess understanding of sequence and causality by having students draw key steps of a process in a series of boxes, revealing whether they grasp order and relationships.
How It Works
- Distribute storyboard template (30 sec) - Give blank 4-6 box grid
- Draw process steps (3 min) - Students illustrate key stages in sequence
- Quick check (30 sec) - Scan for correct sequence and critical steps
What to Say
Opening: "Storyboard the scientific method in 6 boxes. Each box shows one key step. Simple drawings—stick figures welcome! Show the sequence clearly." During: "What happens first?... Then what?... What's the critical next step?... Label each box briefly." Closing: "Your storyboards show me who understands the sequence. Most got steps 1-4 perfect; step 5 needs clarification tomorrow."
Why It Works
Visual representation of processes reveals sequence understanding better than verbal explanation. Drawing forces students to identify essential steps and their order—surface knowledge breaks down quickly.
Teacher Tip
Emphasize: artistic quality doesn't matter. Stick figures and simple shapes work perfectly. It's about sequence and causality, not drawing skill.
Variations
Subjects: Scientific processes (photosynthesis, water cycle), historical events, plot structure, problem-solving steps, algorithms • Boxes: 4-6 for simple processes, 8-12 for complex • Ages: K-5: 3-4 boxes; 6-12: standard; College: complex multi-stage processes
Online
Digital drawing tools (Jamboard, Miro, PowerPoint). Students create visual sequence and submit.
Troubleshooting
"I can't draw": "Draw a square for each step. Write what happens in the square. That's a storyboard!"
Extension
Pair-share: Exchange storyboards. Can your partner follow your sequence? Do they identify a missing step?
Related: Doodle Dictionary, Concept Mapping